Why we built Moonlight
You back four companies and end up with four spreadsheets, none of which tell you which project is burning cash. That gap is what we set out to close.
Moonlight is being built by Loom Bridge FZCO for investors, founders and holding teams who run several entities and want one place to compare project-level financials, backed by real documents. The product is in active development, so a few details below describe where the platform is going as much as where it is today. We try to be clear about that wherever it matters.
The visibility gap
You back a company, or you run a holding with several subsidiaries. The founder sends a quarterly spreadsheet: revenue up, expenses stable, all good.
You want to go a layer deeper. Which project inside that company is profitable? Which one is bleeding money? How much went to contractors last month, and is there proof? Where does the cash go between parties?
You ask, and the answer takes a week. Someone exports data from QuickBooks, merges it with another export, formats a deck. By the time the numbers reach you they are out of date.
Multiply that by four companies, each with three to five projects. Accounting is fine, every company has an accountant. The missing piece is a layer where you can look at project-level financial data across entities, with the documents sitting right next to it.
Workspaces: one company, one workspace
Moonlight organises finances by workspaces. A workspace is a self-contained environment with its own entries, parties, documents, accounting connections and access controls.
Company A is a workspace. Company B is another. Your holding is a third. An investor opens the sidebar and switches between them. A founder sees only the workspace they belong to.
Each workspace connects to its own QuickBooks (or other accounting system). Sync settings, review requirements and chart-of-accounts mappings stay inside the workspace. The accountant for Company A works only on Company A. The investor sees all three.
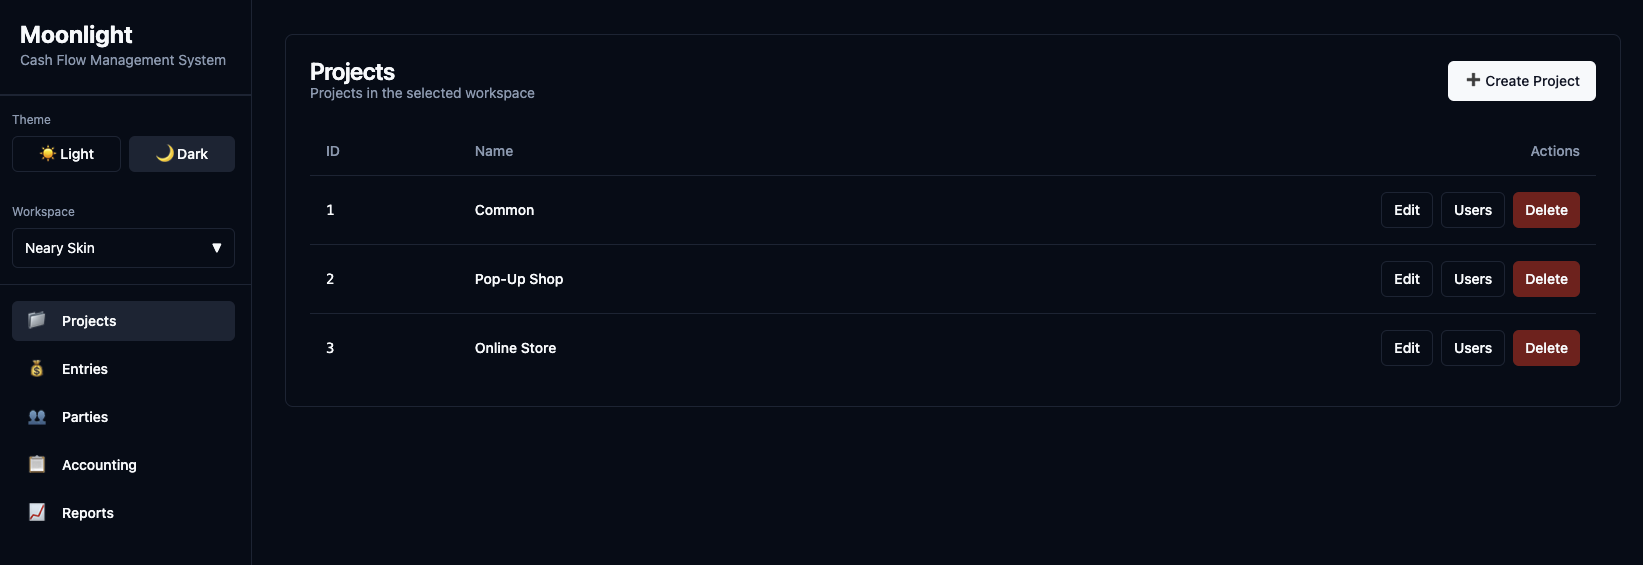
Projects: where the insights live
Inside each workspace, entries are grouped by project. A project can be a client engagement, a product line, a department, a cost centre, a geography. Whatever cut makes sense for that company.
This is where investor questions get a real answer. "Show me income and expenses for Project Alpha in Q1" is a filter, not a request to someone's finance team. "Compare Project Alpha to Project Beta" is two rows in the same report.
A workspace can hold twenty projects. Each one collects its own income and expenses. When you set up an accounting connection, you decide which projects route through it. Project A and B sync to one QuickBooks entity, Project C syncs to another.
Analytics that answer investor questions
Reports live inside each workspace and can be filtered by project, party, tag or time period. You open the reports tab and the data is there.
The current build covers four views.
A project view shows income, expenses and net per project. An investor compares profitability inside one company. A holding manager compares the same project type across entities. The numbers come from verified entries, not from self-reported summaries.
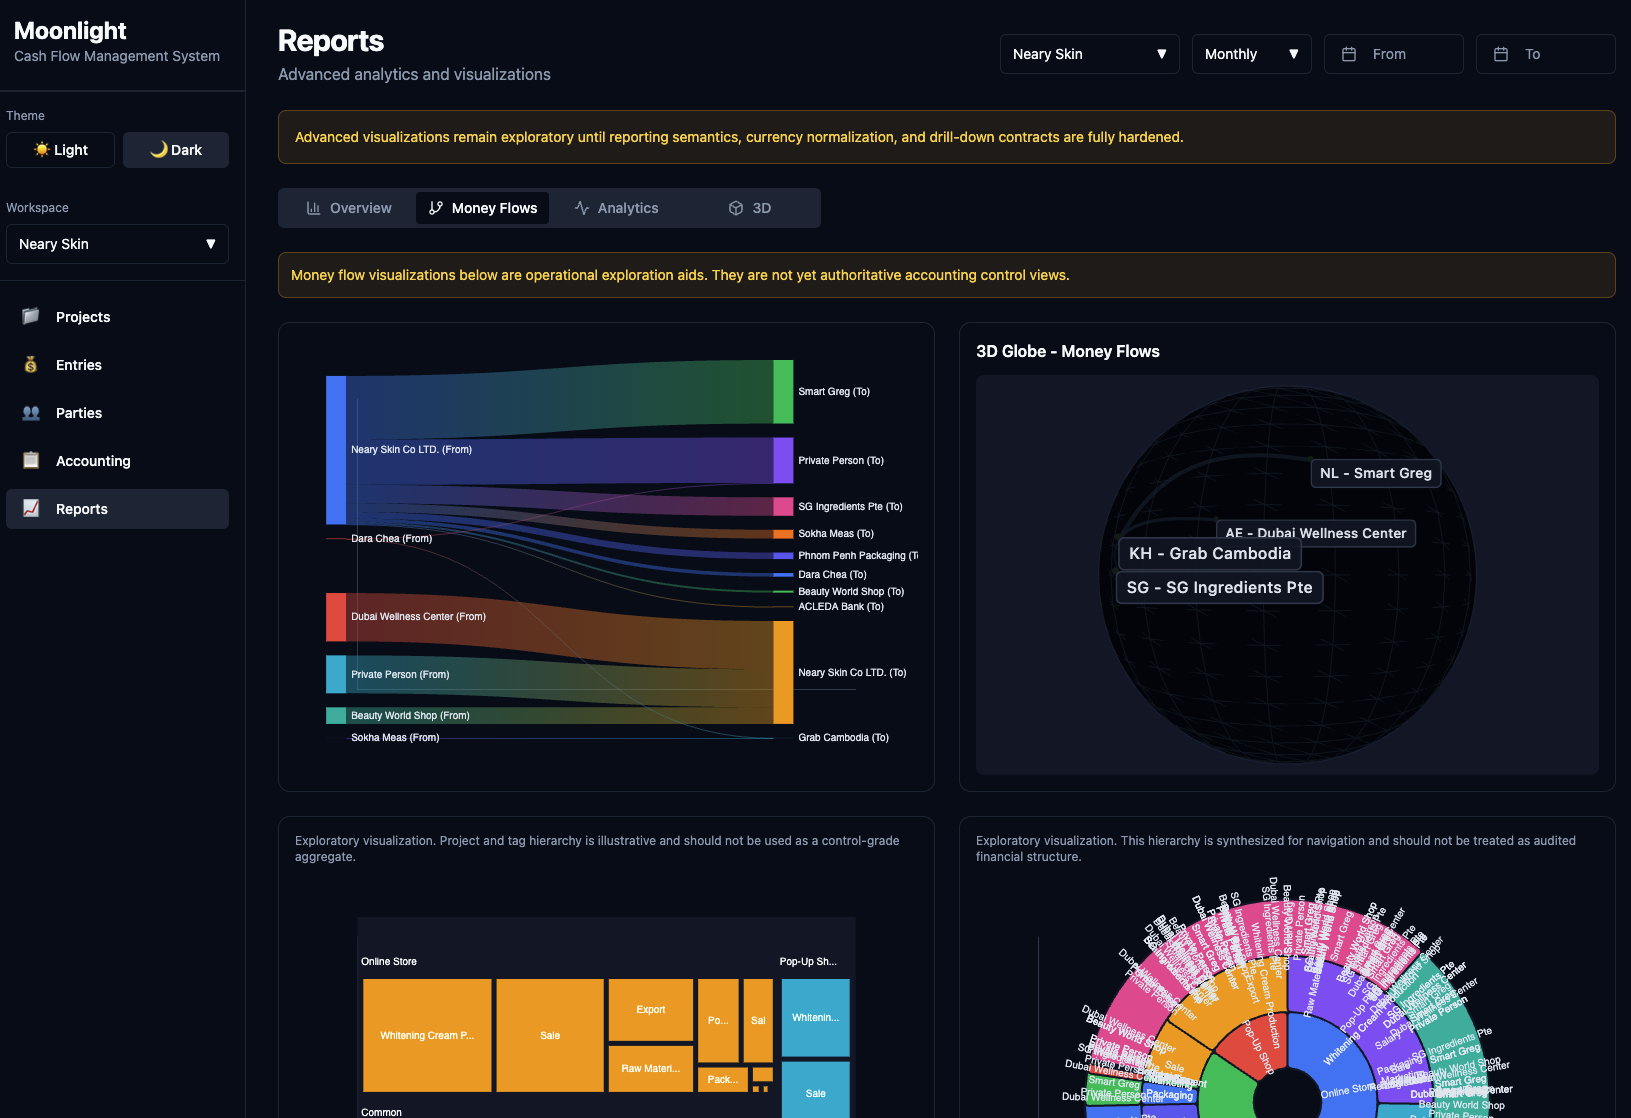
A party view breaks spend down by counterparty. Which vendors get the most money? Is the same contractor being paid out of three projects? The breakdown uses directional counterparties, so vendor spend is not double-counted.
A tag view groups entries by operational category like marketing, R&D or infrastructure. Tags allocate proportionally when an entry has more than one tag, so filtering by "R&D" across all projects gives a clean number without overlap.
The flows view is a Sankey diagram of money moving between parties. A $200K-a-month vendor concentration shows up at a glance instead of after digging through transaction lists.
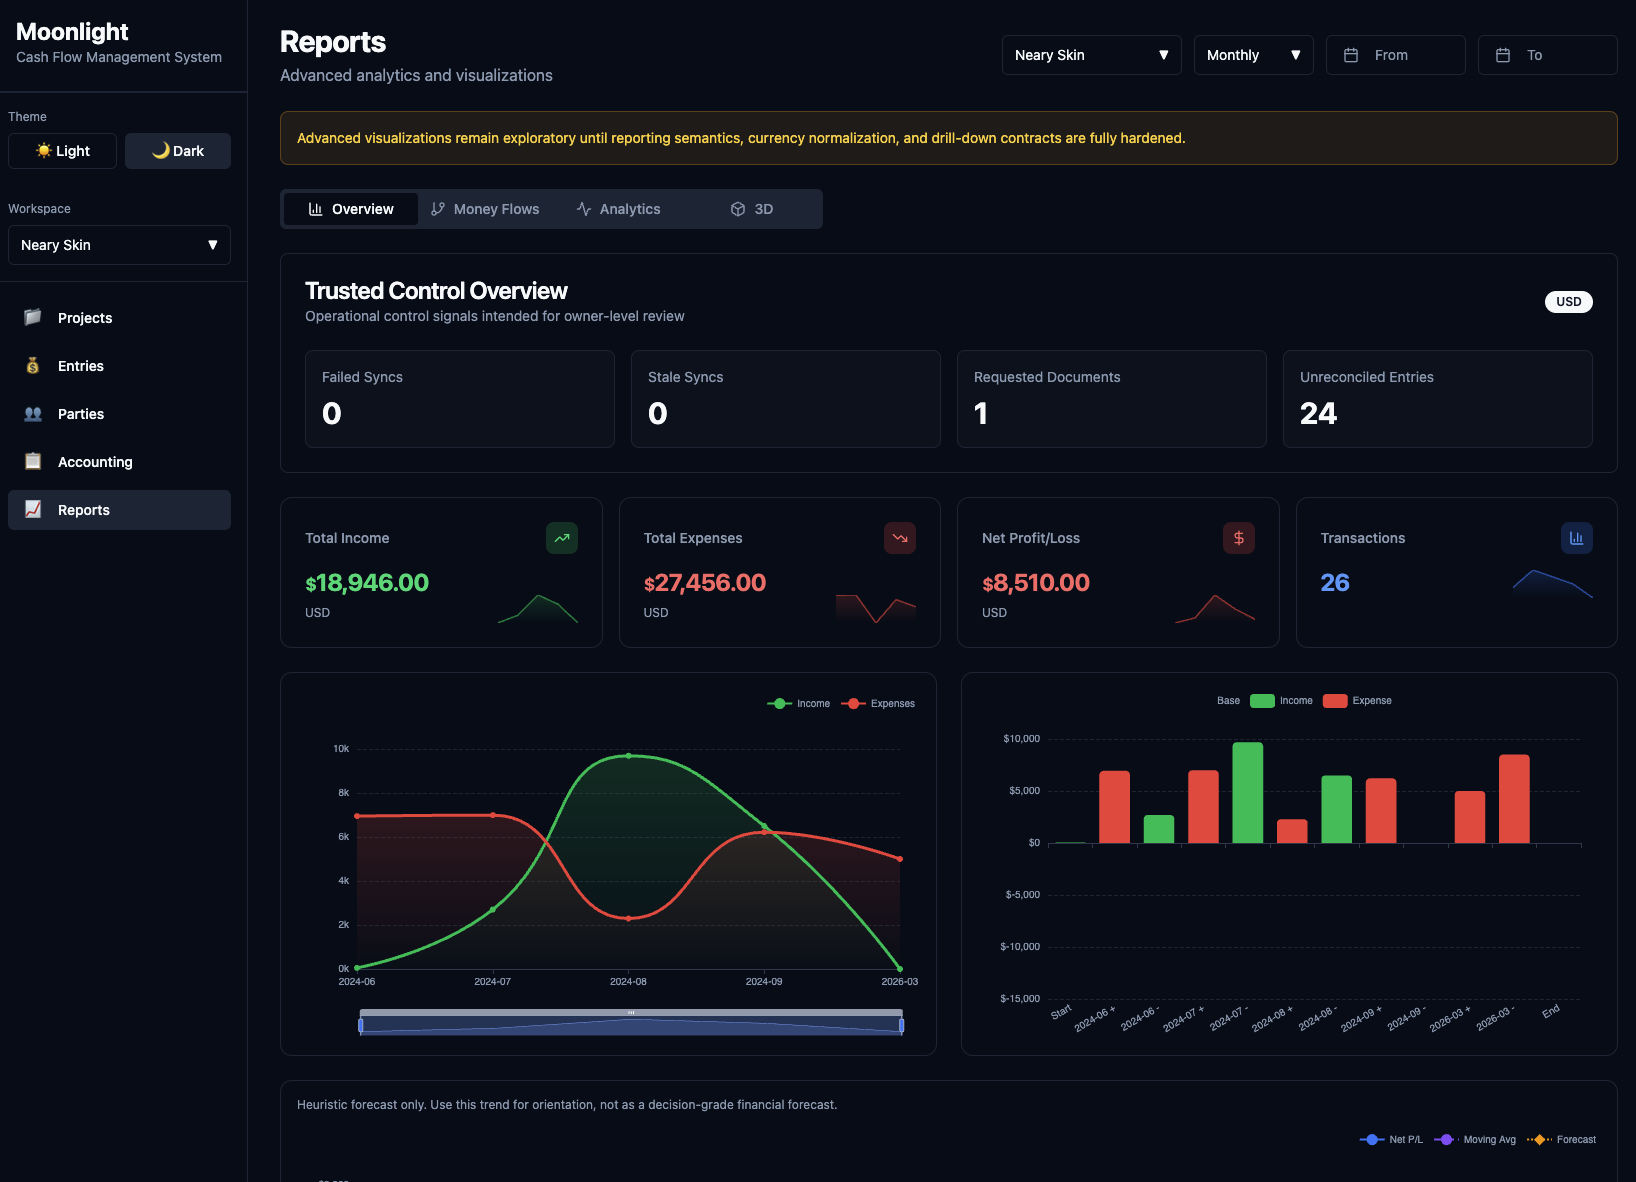
Multi-currency workspaces get per-currency breakdowns. A company that runs EUR and USD sees totals for each currency on its own line, with no implicit FX conversion masking the picture. Cross-currency consolidation is on the roadmap and will land behind a setting once the team is comfortable with the FX model.
Every number has a document behind it
Every financial operation lives as an entry: income or expense, with a status lifecycle (PENDING → UNDER_REVIEW → COMPLETED or VOIDED), linked documents and an audit trail.
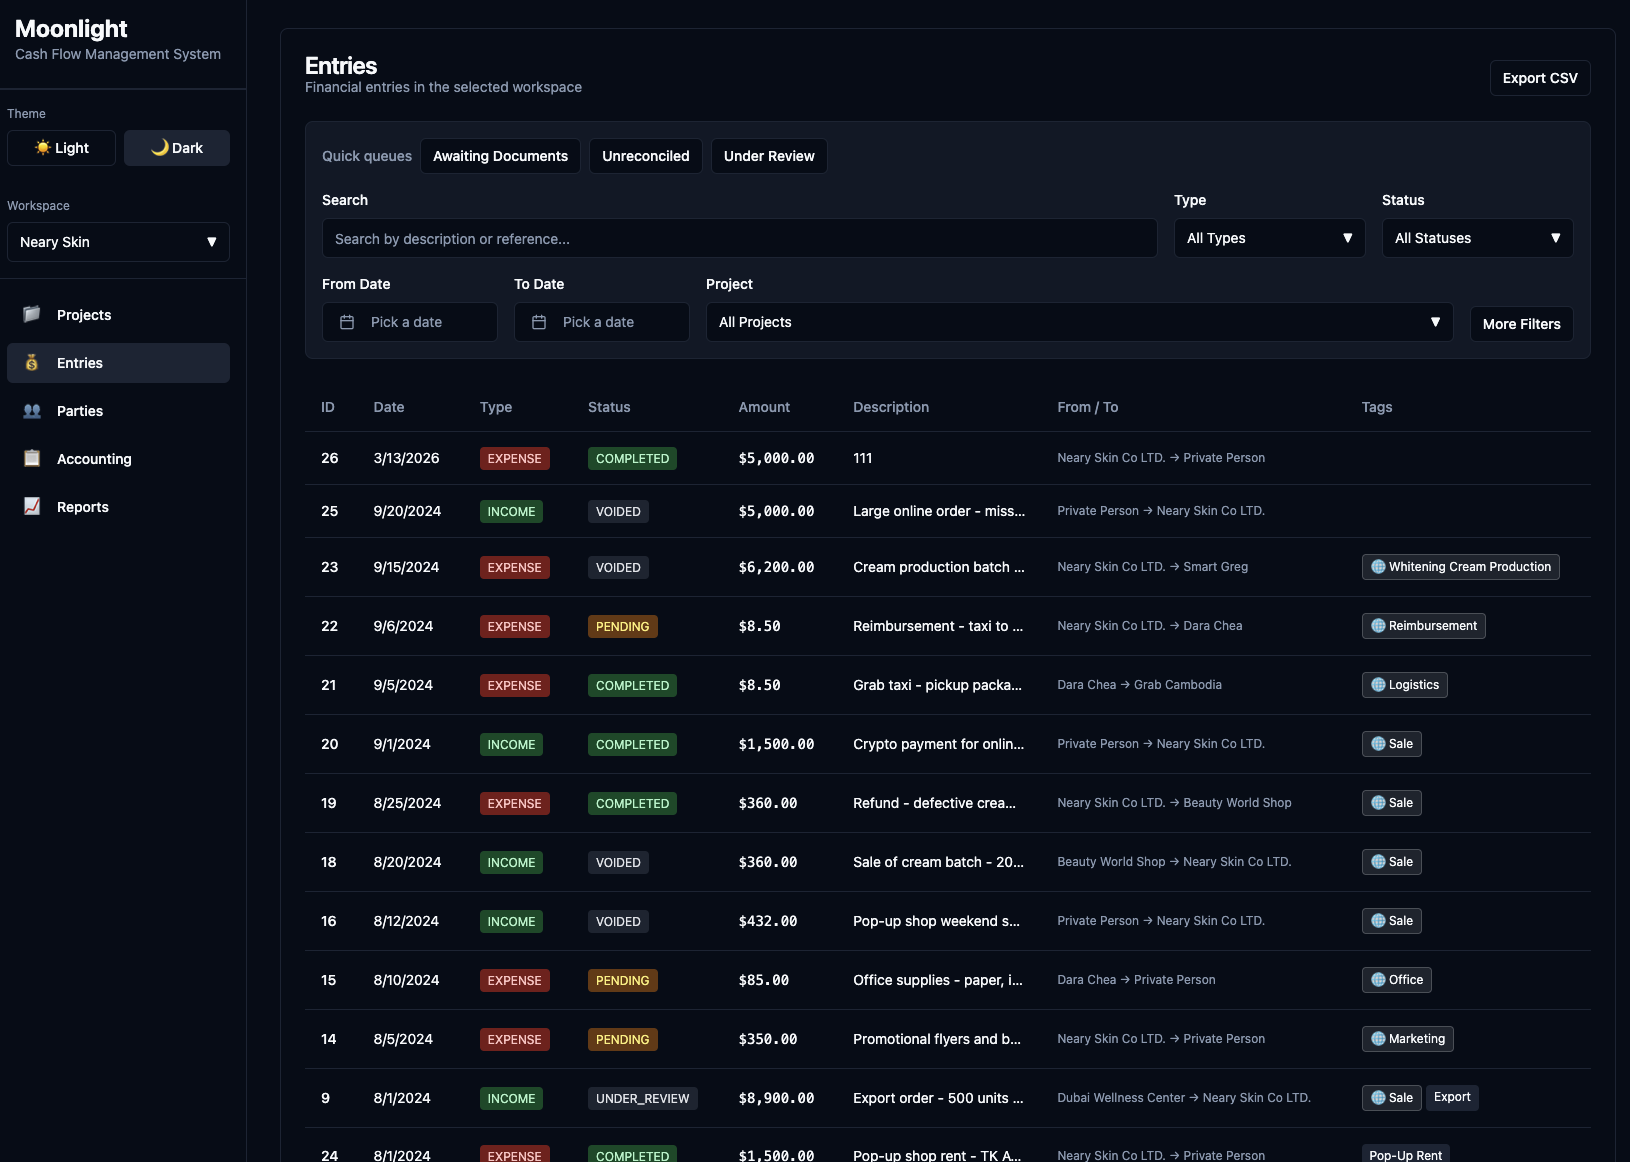
Each entry runs through a completeness model. A vendor payment needs an invoice and a payment confirmation. A reimbursement needs a receipt and an approval. The system recalculates completeness as documents are uploaded and approved.
For an investor, this is the difference between a number on a slide and a number you can audit yourself. When you see a $50K expense in the reports, you can drill into the entry and find the invoice, the payment proof and the accountant's note. You are looking at data that was checked, not at a copy of a bank statement someone pasted into a sheet.
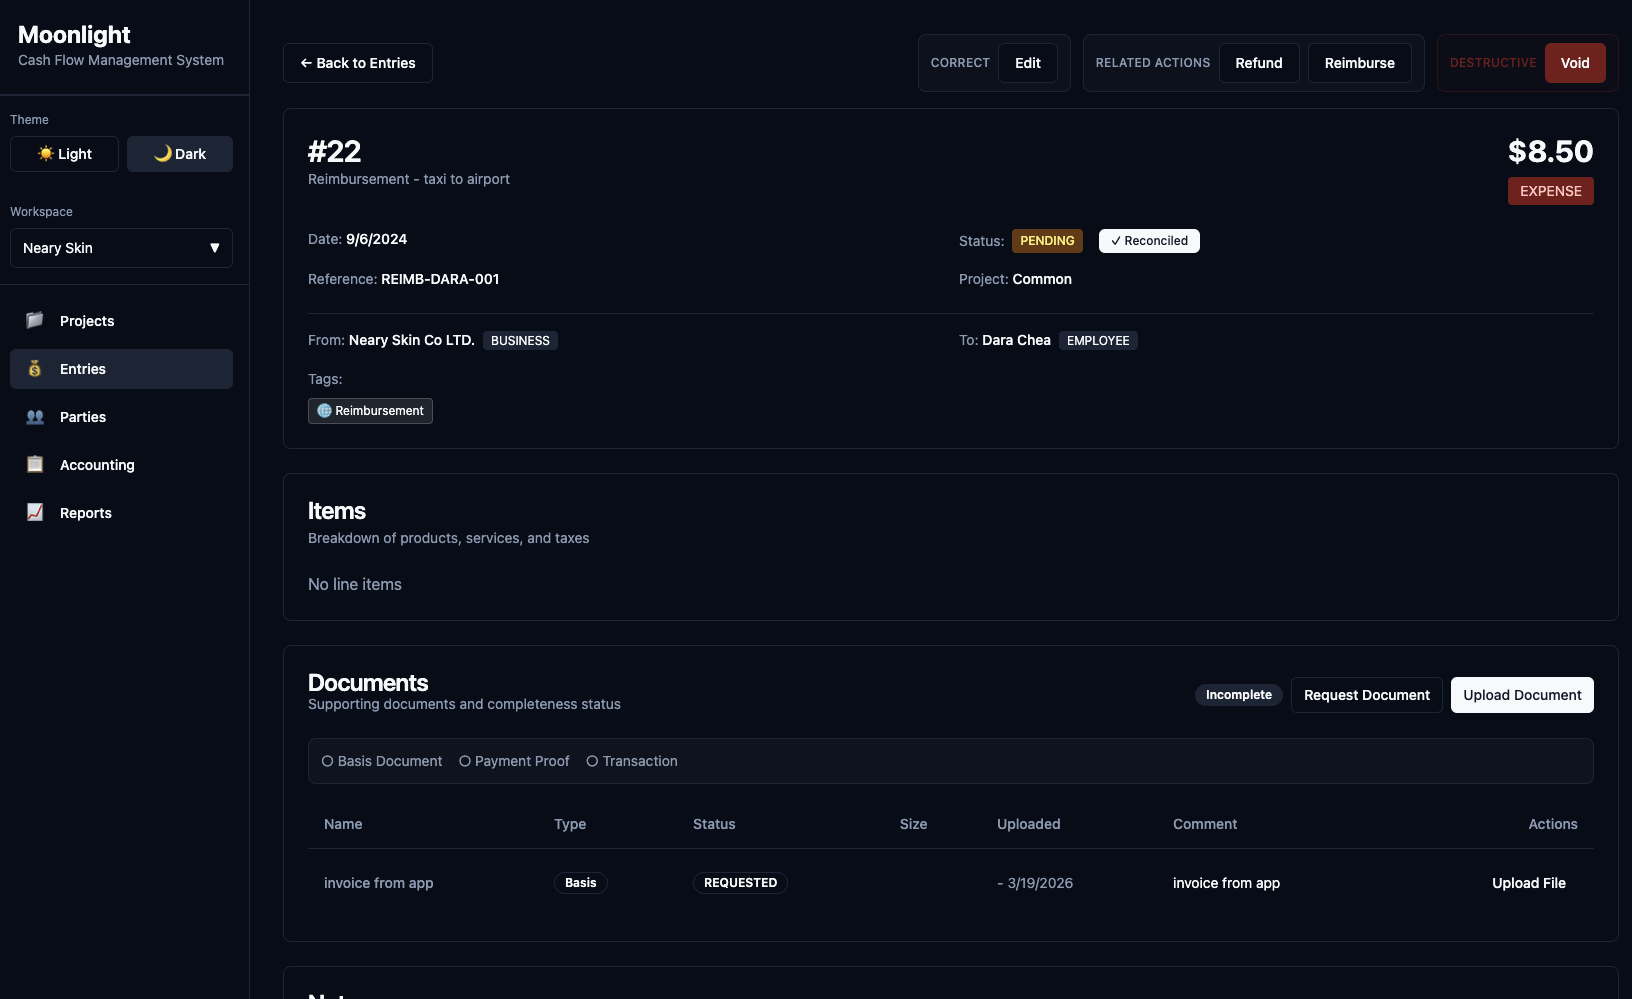
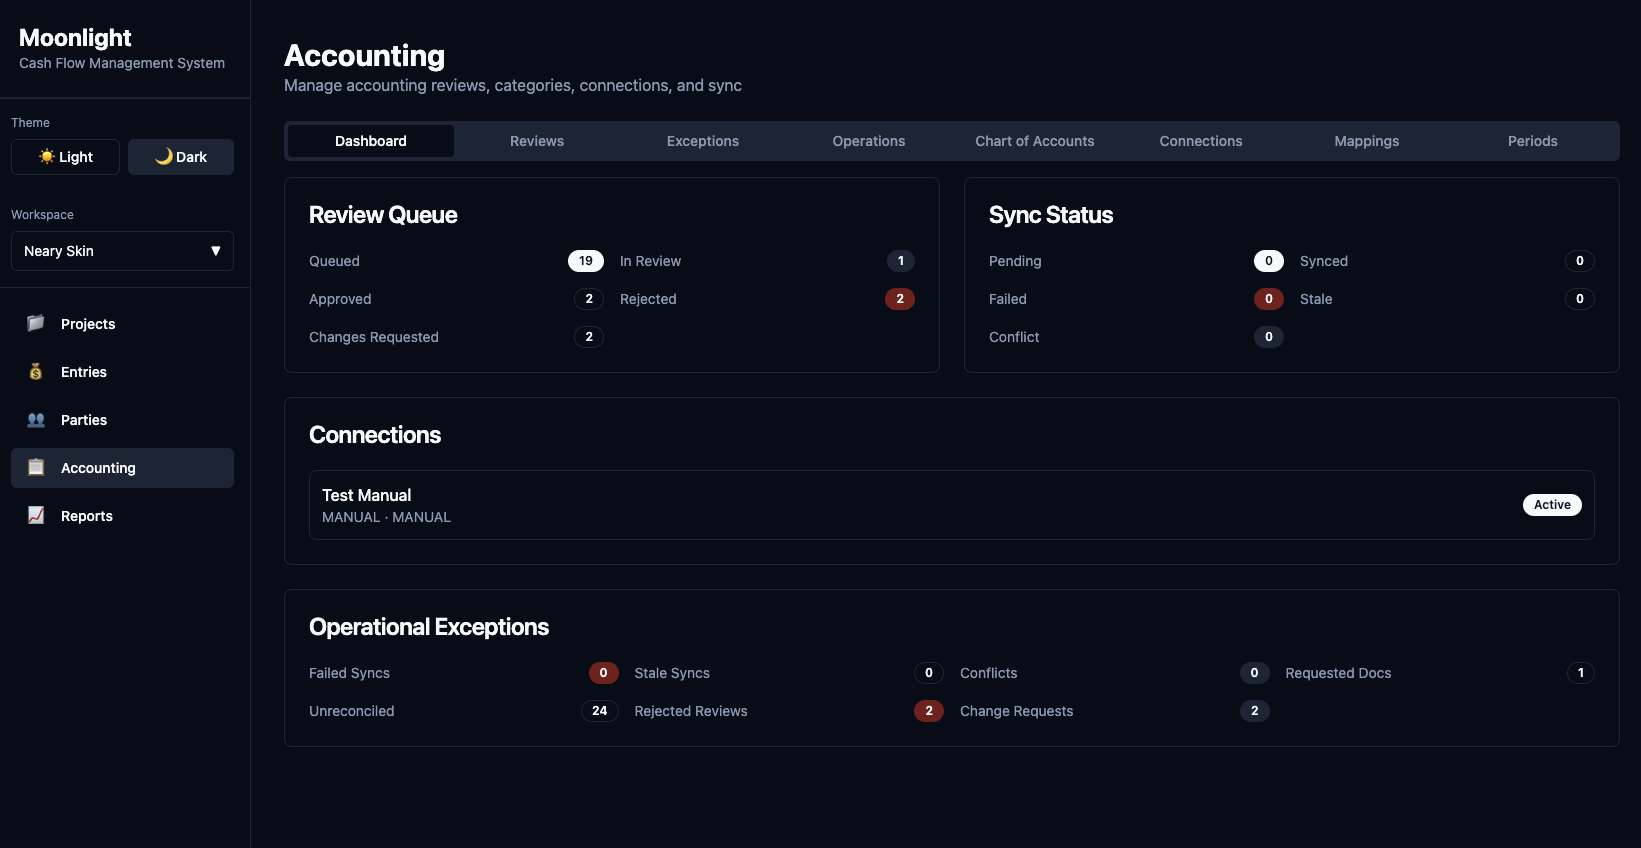
Accountants review entries before they reach the books. They approve, reject or request changes. The review queue is scoped to the reviewer's workspace.
QuickBooks integration per workspace
Each workspace connects to its own accounting system. Today the supported provider is Intuit QuickBooks. Moonlight pushes entries after review, pulls category updates and handles webhooks for status changes. A "Manual" connection mode is also available for teams that want the review workflow without an external system.
Entries reach your books only after documents are attached and an accountant approves the review. The QuickBooks side stays clean because Moonlight enforces the verification step before anything is pushed.
Connection-project routing decides which entries go where. A workspace called "US Operations" with three projects can route two of them through one QB connection and the third through another.
Support for additional providers (Xero is the most asked-for) is planned. The provider interface is already extensible, so adding a new integration is a matter of implementing the contract rather than reworking the core.
Who this is for
Moonlight is built with four roles in mind.
Investors and holding managers who need project-level visibility across several companies. Each portfolio company is a workspace, each business line a project. Read-only roles let you look at the data without touching operations.
Founders running two to five entities who want one place to see all their companies side by side and to give investors their own access instead of preparing decks every quarter.
Finance teams at 10 to 200 person companies that have outgrown single-entity tooling. Departments or business lines become workspaces or projects, and access controls decide who sees what.
Accountants managing several clients. Each client is a workspace. Reviews, document checks and pushes to QuickBooks happen per client, all inside one tool.
What Moonlight is not
Moonlight is not a replacement for QuickBooks, Xero or your ledger. It does not do payroll, invoicing or tax filing.
It sits between your operations and your books. A team records what happened, attaches proof, gets it reviewed, and pushes verified data to accounting. Moonlight handles the accountability step. Your accounting system handles the rest.
Try it
- Docs: docs.moon-light.app
- App: moon-light.app
- API: api.moon-light.app
You can use the hosted setup or run Moonlight locally with Docker. If you manage or invest in several companies and still get your financial picture through spreadsheets and slide decks, this is the workflow we are building to replace.